
Engineering value.
Redefining cost.
Cost Engineering, Should Costing and Design-to-Cost for manufacturing companies.
We create transparency across materials, manufacturing processes, investments, labor, overhead and logistics — providing the fact-based cost intelligence required for better sourcing, engineering and supplier decisions.
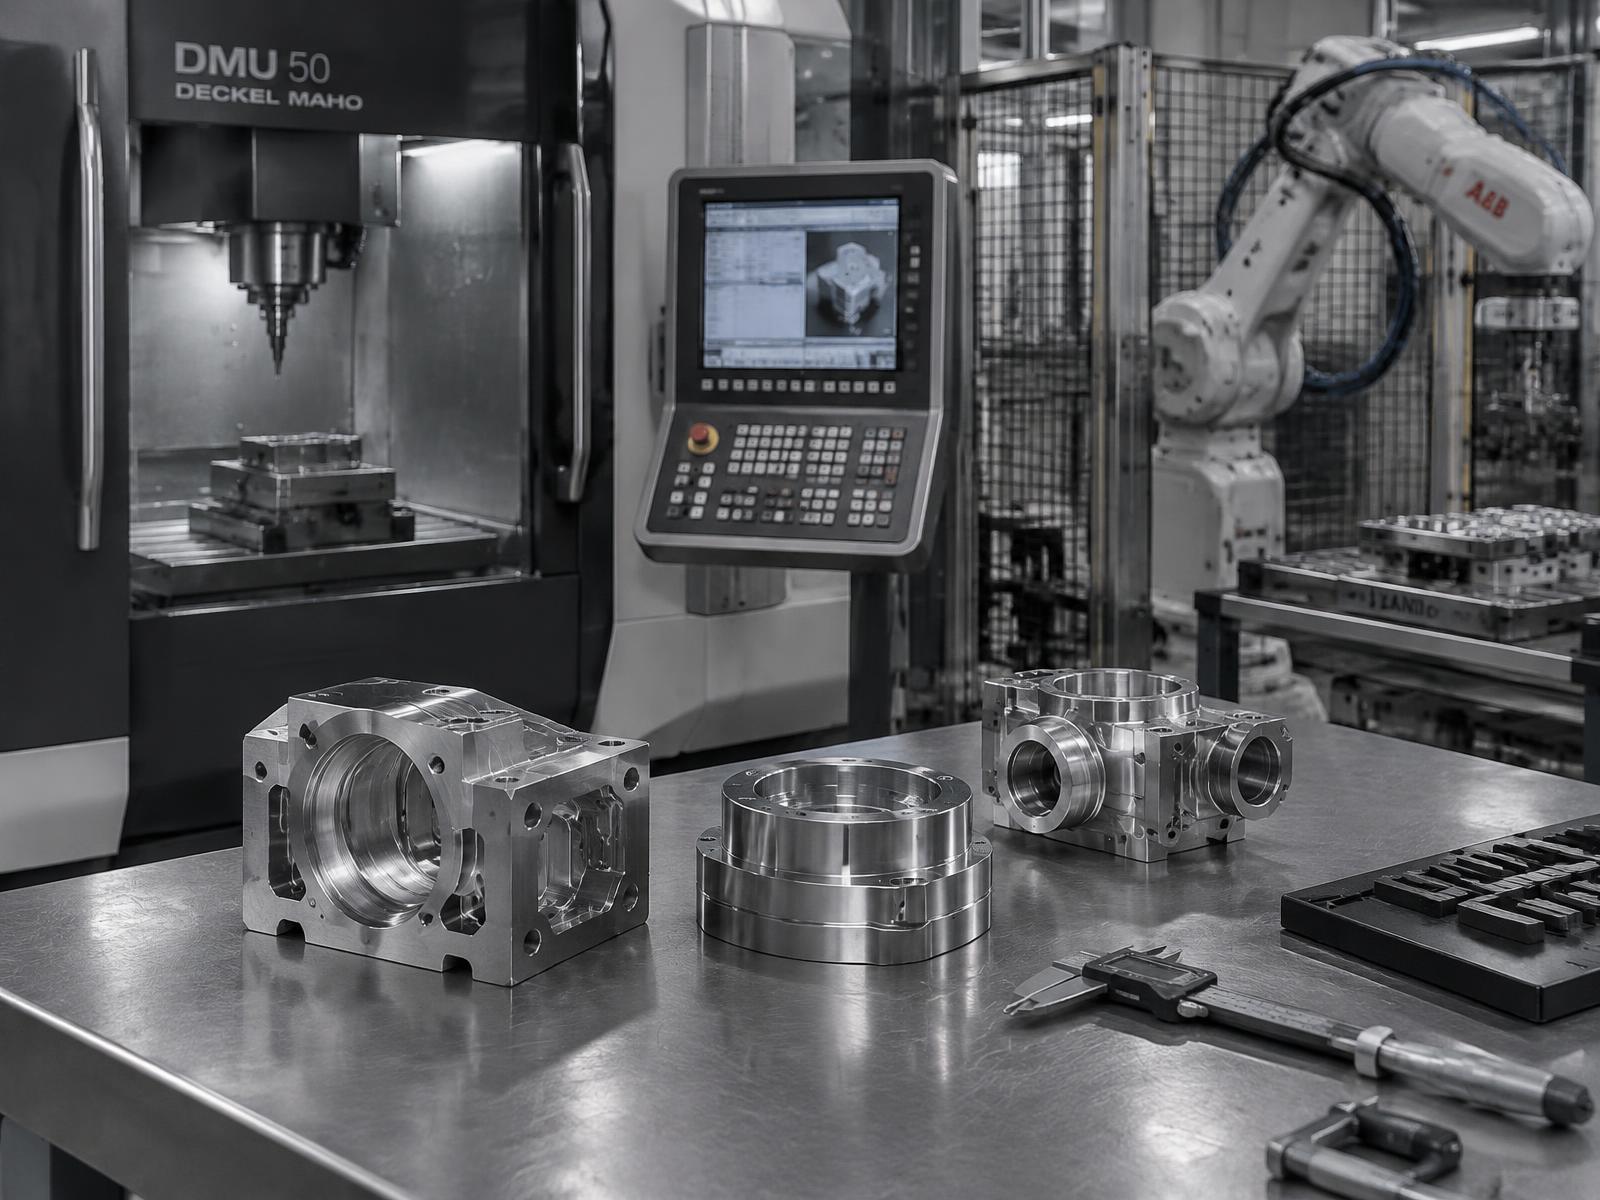
How can we support you?
Should Costing
Bottom-up cost models for products, components and manufacturing processes, built from process times, material usage, machine rates, labor rates, tooling and overhead assumptions.
- Should Cost Analysis
- Supplier Cost Breakdown
- Cost Benchmarking
- Make-or-Buy Analysis
- Cost Driver Analysis
- Negotiation Support
Cost Engineering.
Powered by Costixx.
From data. To cost. To action.
Carbon & Cost combines hands-on manufacturing expertise with Costixx, our proprietary Cost Engineering technology for bottom-up cost modeling, supplier analysis, scenario simulation and opportunity identification.
- 01BUILDBottom-up cost model
- 02CHALLENGESupplier quote & gap
- 03SIMULATESensitivity & scenarios
- 04OPTIMIZETarget cost & levers
- 05TRACKOpportunity tracking
Built around your cost reality — not generic database assumptions.
Project and client-specific cost data can be prepared and maintained for materials, components, machine rates, labor rates and regional manufacturing assumptions.
- Materials
- Components
- Machines
- Labor
- Countries
- Currencies

Challenge supplier pricing with facts.
Rebuild supplier pricing from the manufacturing side and identify the gap between quotation and calculated Should Cost by cost element.
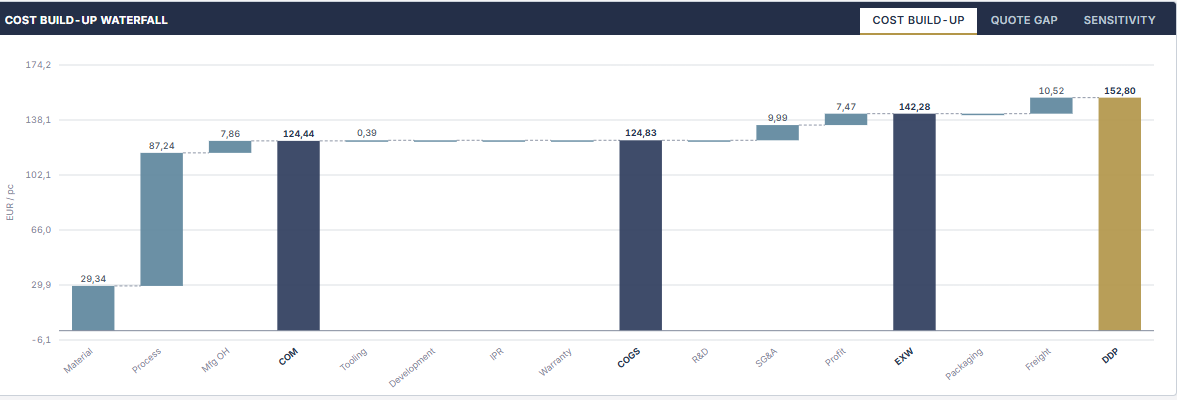
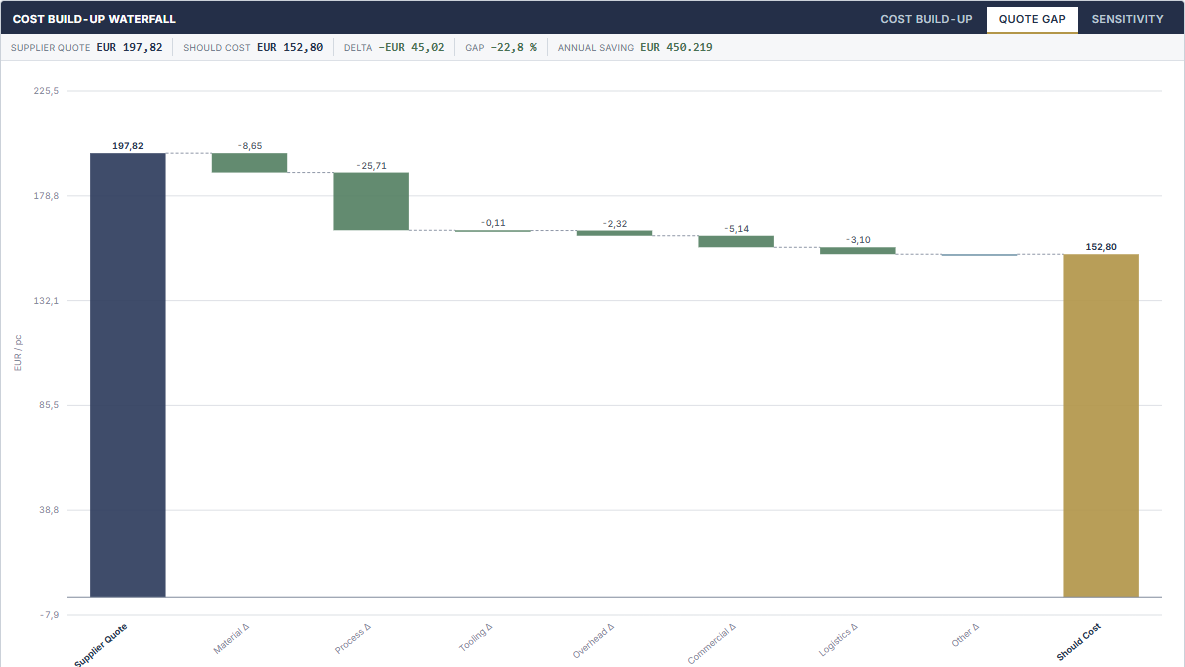
Cost models built from process knowledge, machine assumptions, cycle times, tooling concepts and production economics.
Cost intelligence based on actual client and project data — not generic benchmarks or database assumptions.
From supplier quotation and Should Cost to target cost, optimization opportunity and measurable financial impact.
See what sits behind the analysis.
Explore the complete Costixx Cost Engineering platform, including cost modeling, databases, supplier analysis, scenarios, target costing and opportunity management.
Know what
it should cost.
We develop detailed bottom-up cost models for products, components and manufacturing processes. Each model is built from the actual process route — not from price history — so every cost element can be reviewed, challenged and discussed with suppliers.

- MaterialRaw material, scrap, purchased parts34%
- ManufacturingProcess route, cycle time, yield18%
- LaborDirect labor, shifts, regional rates11%
- MachineMachine hour rate, utilization10%
- ToolingTool cost, amortization, lifetime7%
- InvestmentEquipment, automation, capacity6%
- OverheadManufacturing and SG&A overhead8%
- LogisticsPackaging, freight, duties3%
- MarginSupplier profit expectation3%
Illustrative structure — actual distribution depends on part, process and volume.
Included in an engagement
- 01Should Cost Analysis
- 02Supplier Cost Breakdown
- 03Cost Benchmarking
- 04Make-or-Buy Analysis
- 05Supplier Negotiation Support
- 06Cost Driver Analysis
From Should Cost
to True Cost to Lean Cost.
We don't stop at the model. We validate cost on the shop floor and then optimize the underlying product and manufacturing process.
Should Cost
Develop a bottom-up cost model using product specifications, drawings, BOM data, material prices, manufacturing assumptions, regional rates, process parameters and supplier information.
- Drawings & BOM
- Material prices
- Process assumptions
- Machine rates
- Labor rates
- Tooling
- Overhead
- Logistics
True Cost
Validate the cost model directly at the manufacturing site using actual production conditions and measured process data.
- Actual machines
- Actual process route
- Actual cycle times
- Actual labor content
- Actual material consumption
- Actual scrap & yield
- Actual tooling
- Actual energy consumption
- Actual capacity & utilization
- Actual manufacturing conditions
Lean Cost
Use the validated manufacturing baseline to identify and quantify cost optimization opportunities across product and process.
- Cycle time
- Material usage
- Scrap & yield
- Labor content
- Automation
- Machine utilization
- Process flow
- Tooling
- Logistics
- Product design
- Design-to-Cost
- VA/VE
See the methodology
in practice.
From the initial Should Cost model to physical shop-floor validation and engineering optimization — selected engagements show how cost transparency is converted into implemented savings.
Cost is created on the shop floor.
That's where we validate it.
Our Cost Engineers work hands-on at the manufacturing site, physically following the product through the production process and validating the assumptions behind the cost model against actual shop-floor conditions.
Cost Engineers physically follow the product through the production process and validate the model against actual manufacturing conditions.
- 01Material cost improvement
- 02Line balancing
- 03OEE
- 04Process optimization
The model doesn't define reality.
The shop floor does.
True Cost replaces assumptions with validated manufacturing data before optimization begins.
Selected anonymised client engagements. Results shown relate to the specific project scope and conditions and should not be interpreted as typical or guaranteed savings.
What is the true cost
behind your supplier quote?
Start with a Should Cost model. Validate it where the cost is created. Then identify what the product could cost.
Should costing. On demand.
You send product information, drawings, BOMs and any available supplier data. We perform the analysis remotely and return a detailed, fact-based should-cost model — without setting up a traditional consulting engagement.
Analyses can typically be delivered within 5–10 days, depending on part scope and data availability.
- 01
Upload / Provide Data
Drawings, BOMs, specifications, volumes, available supplier quotes.
- 02
Product & Process Analysis
Material selection, process route, cycle times, tooling concept.
- 03
Should Cost Calculation
Bottom-up model with regional machine, labor and overhead rates.
- 04
Cost Driver Review
Identification of the elements that actually determine the price.
- 05
Results & Recommendations
Documented cost model, assumptions and improvement levers.
- 06
Supplier Negotiation Support
Argumentation base and fact sheets for commercial discussions.
Cost engineering across the product lifecycle.
Engineering decisions and cost outcomes are inseparable. We work along the full lifecycle, from the first concept assumptions to series production and re-optimization.
Cost is designed
into the product.
The largest cost opportunities usually originate before sourcing and production. Material choice, process route, tolerances and assembly concept define the cost band a supplier can quote within — long before a price is negotiated.
- MaterialCurrent
- Manufacturing ProcessCurrent
- Part ComplexityCurrent
- ToleranceCurrent
- AssemblyCurrent
- ToolingCurrent
- Reduced material usageOptimized
- Simplified processesOptimized
- Lower cycle timeOptimized
- Reduced toolingOptimized
- Improved assemblyOptimized
- Lower total product costOptimized
Savings potential is assessed per part and per process — no generalized percentage claims.
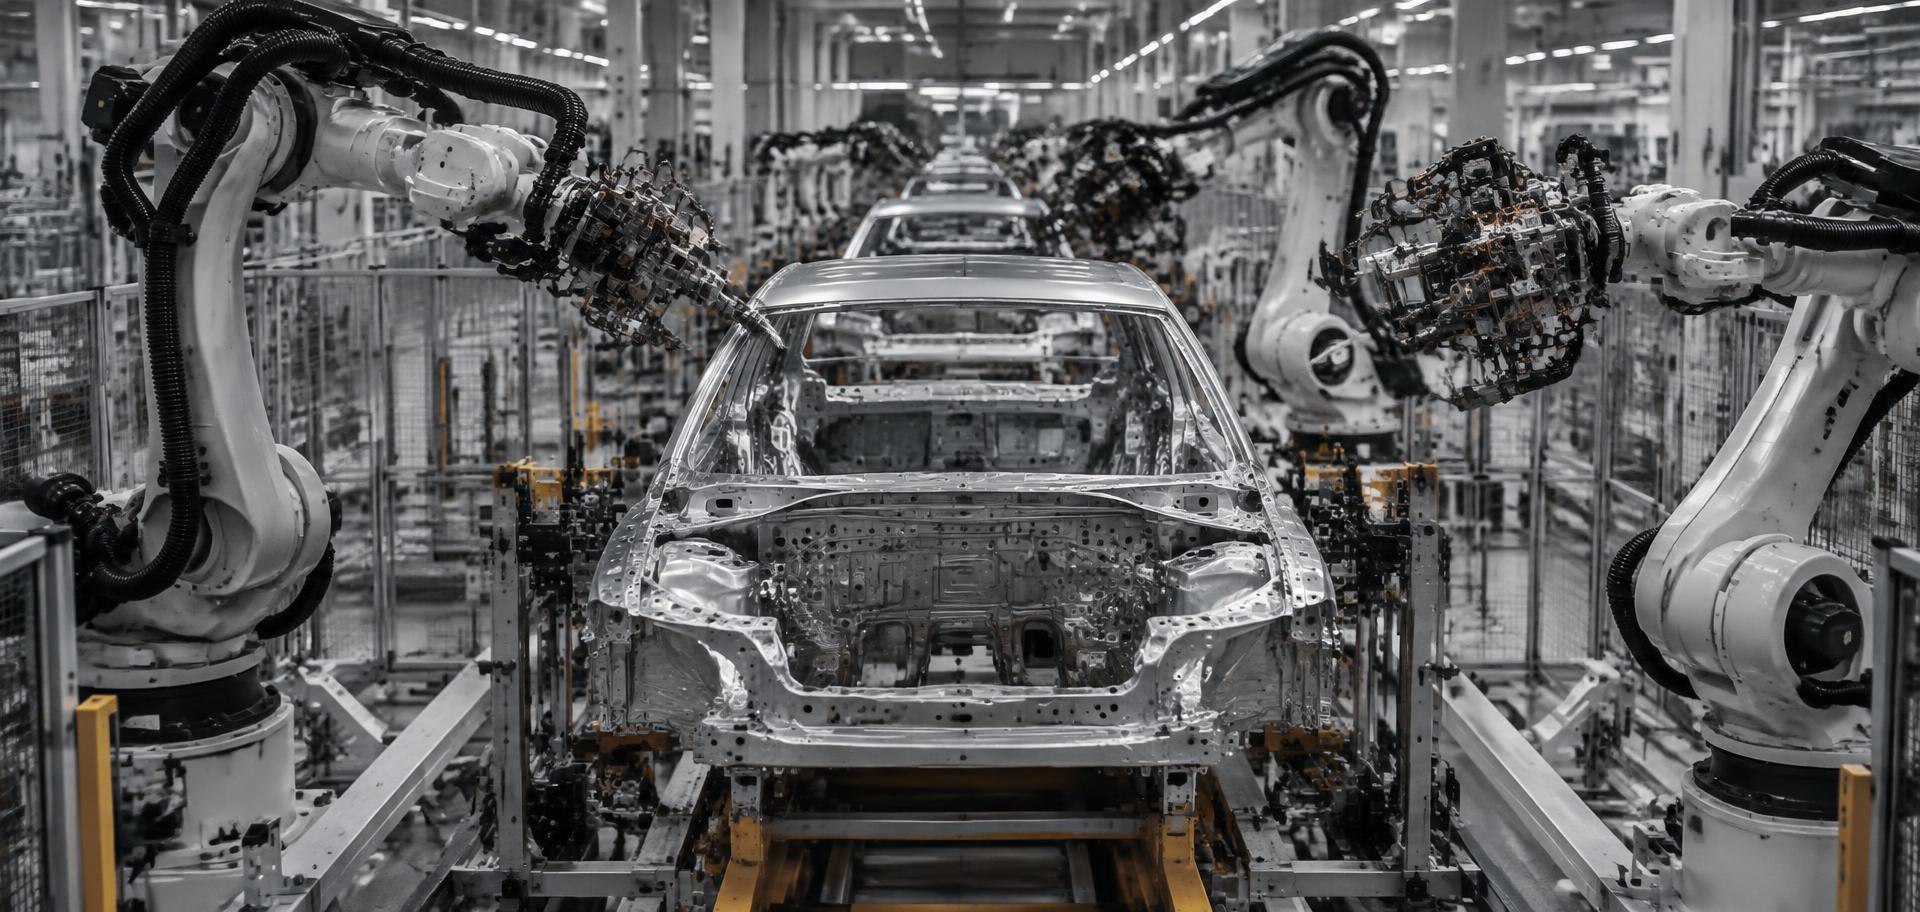
Cost is made on the shop floor
Every model we build is traceable to a process, a machine, a cycle time and a rate.
Turn supplier quotes into facts.
Understand the material, process, labor and investment assumptions behind supplier pricing. We rebuild the quotation from the manufacturing side, so purchasing enters negotiations with a documented position instead of a price comparison.
| Cost element | Quoted | Model | Delta |
|---|---|---|---|
| Raw material, 1.94 kg @ steel index | 3.12 | 2.74 | −0.38 |
| Stamping, 42 strokes/min, 3 stations | 1.08 | 0.86 | −0.22 |
| Machine hour rate, 400 t press | 78.00 | 64.50 | −13.50 |
| Direct labor, 0.14 h | 0.62 | 0.55 | −0.07 |
| Tooling amortization, 400k parts | 0.35 | 0.21 | −0.14 |
| Overhead & SG&A | 0.71 | 0.58 | −0.13 |
| Packaging & freight | 0.19 | 0.19 | 0.00 |
Capabilities
- Supplier Cost Breakdown
- Quote Analysis
- Cost Driver Validation
- Machine Rate Analysis
- Labor Rate Benchmarking
- Material Benchmarking
- Tooling Validation
- Investment Validation
- Supplier Negotiation Preparation
Applied where parts are actually made.
Cost models are only as good as the process knowledge behind them. Our project experience spans discrete manufacturing across Europe, Asia and North America.
Automotive
High volumes, tight tolerances and multi-tier supply chains where a fraction of a cent per part is material.
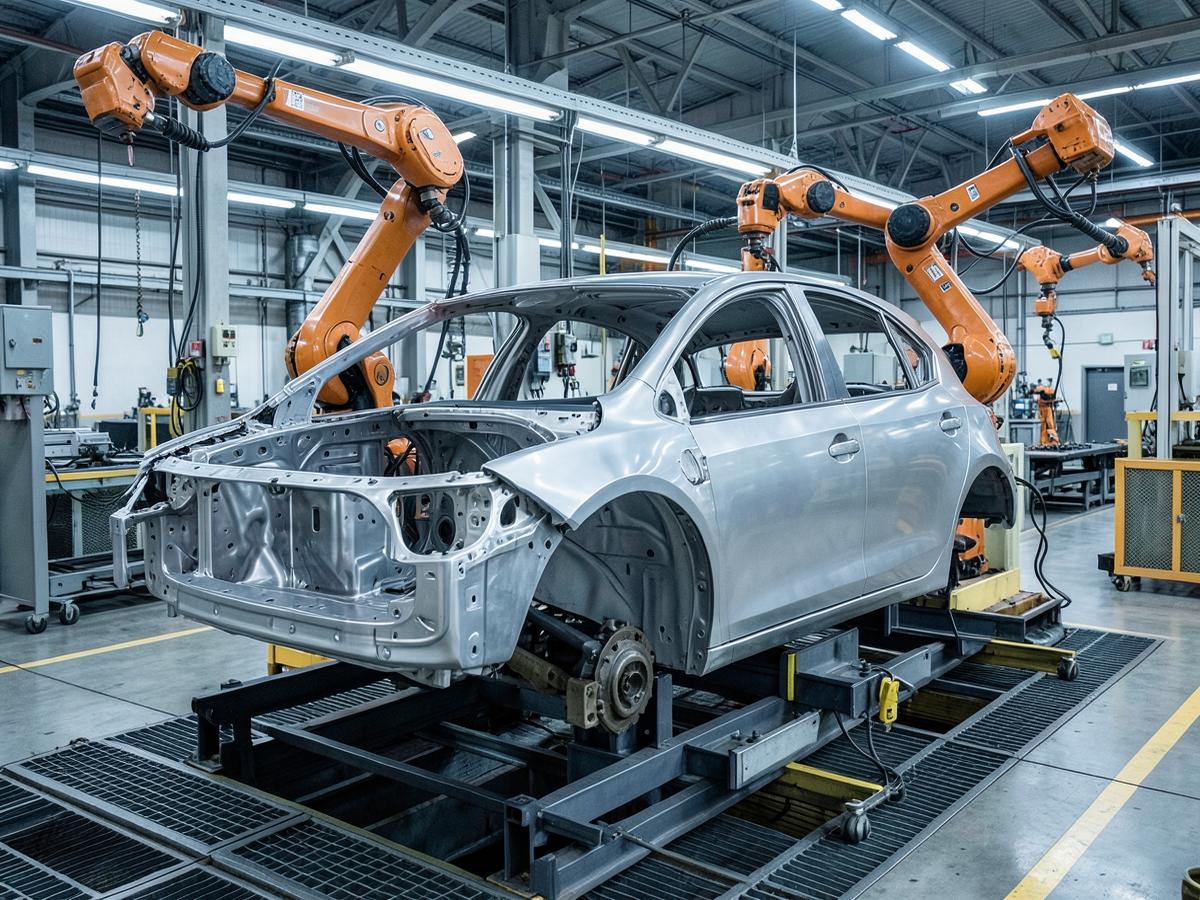
- Stamped and formed metal parts
- Injection moulded interior and exterior parts
- Die cast structural components
- Tooling and investment validation
- Tier-1 / Tier-2 cost cascading
- Annual productivity negotiations
Cost engineering requires manufacturing knowledge.
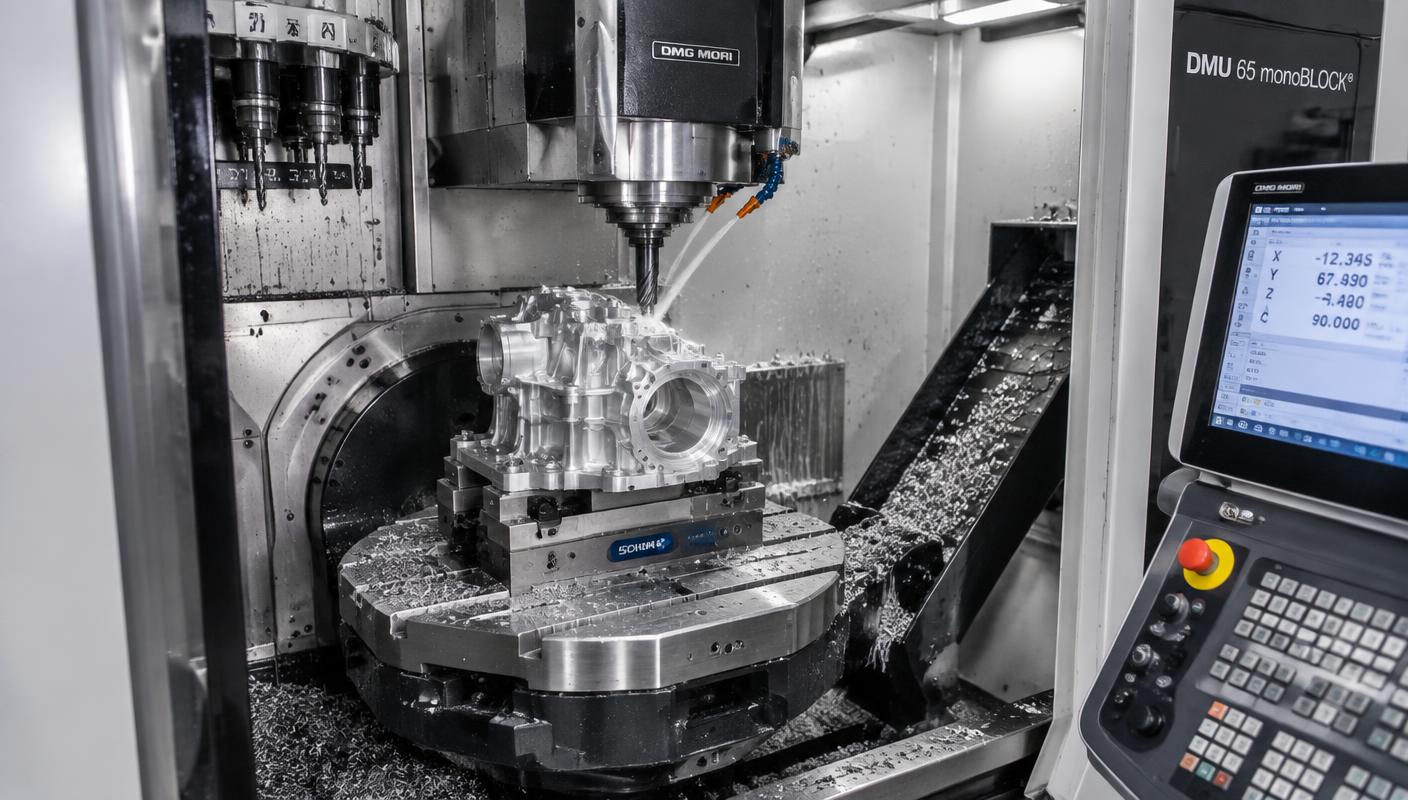
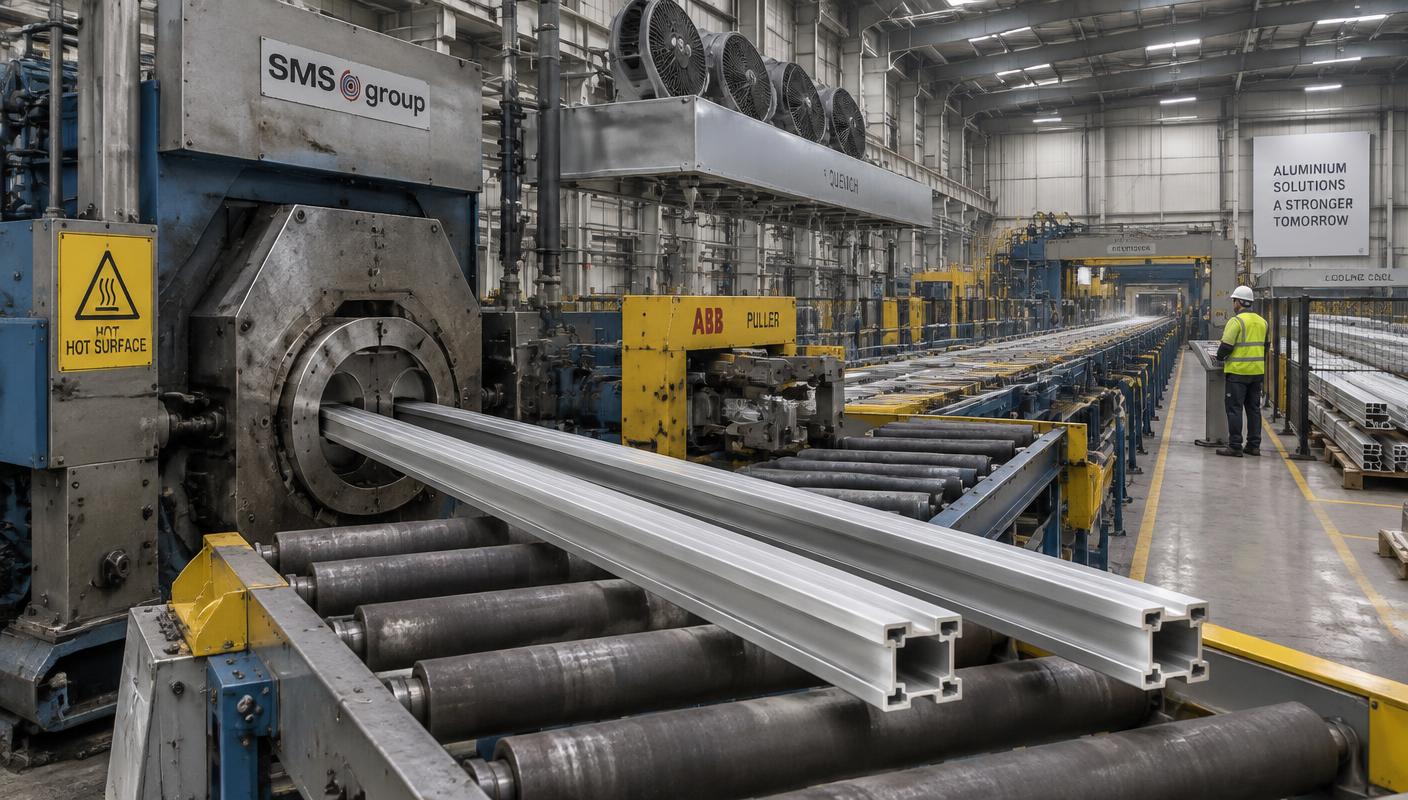
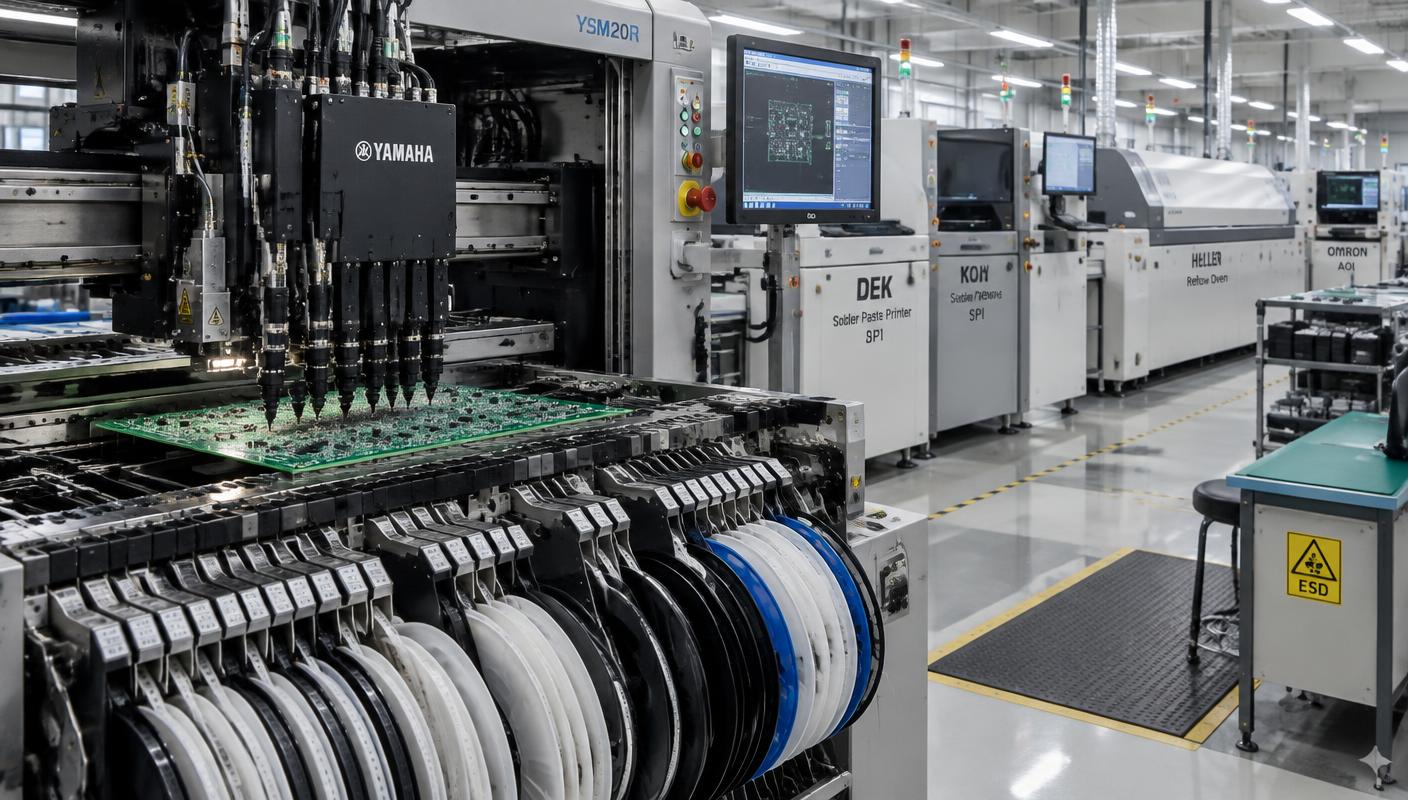
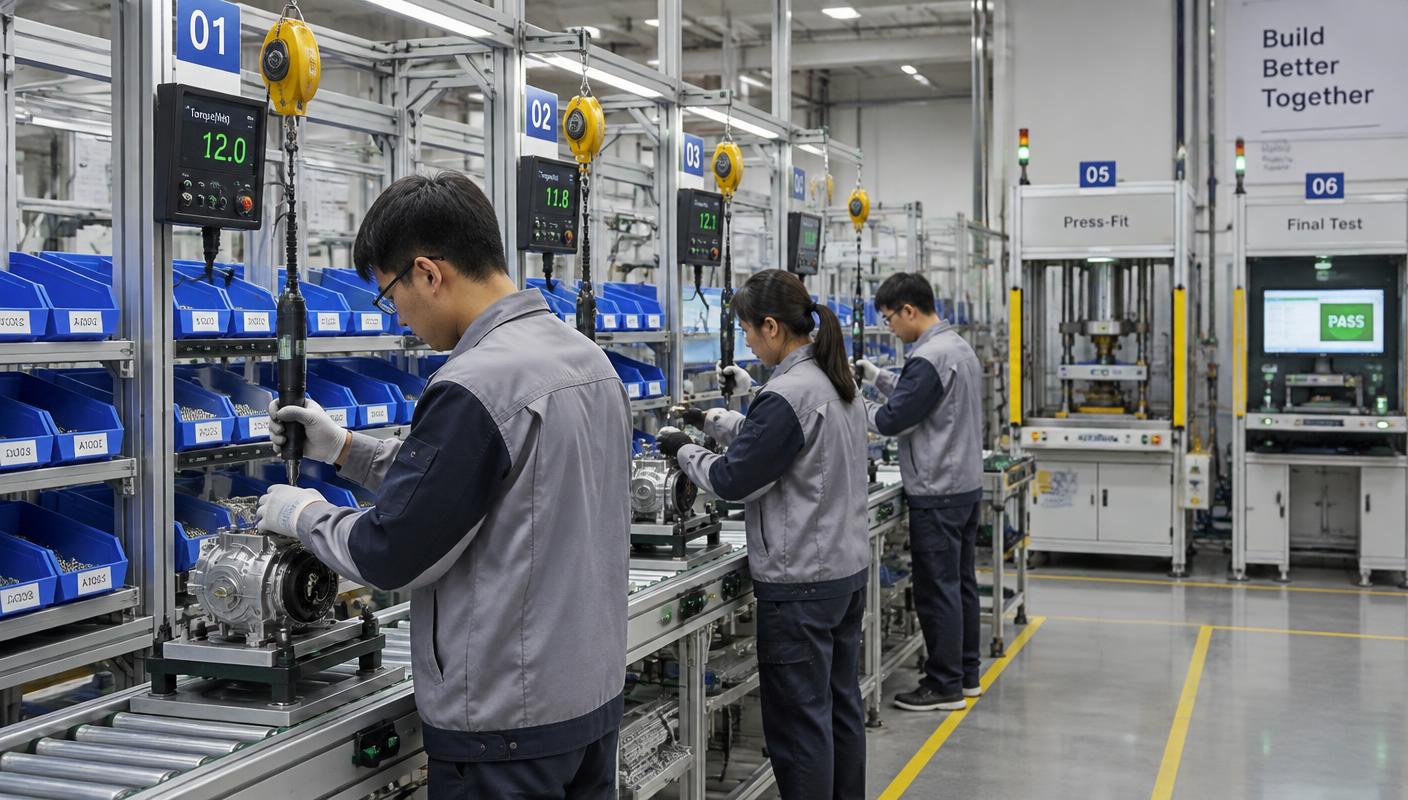
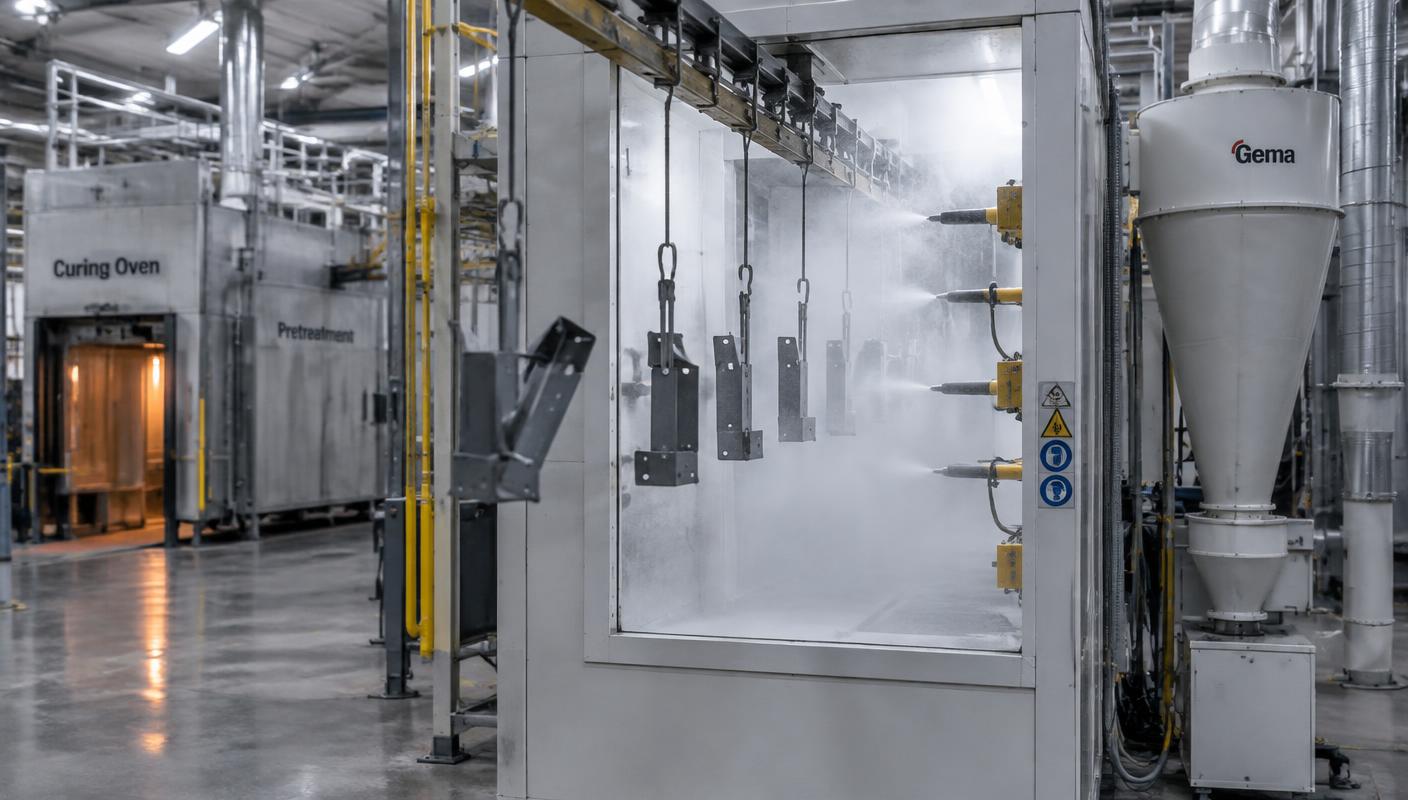
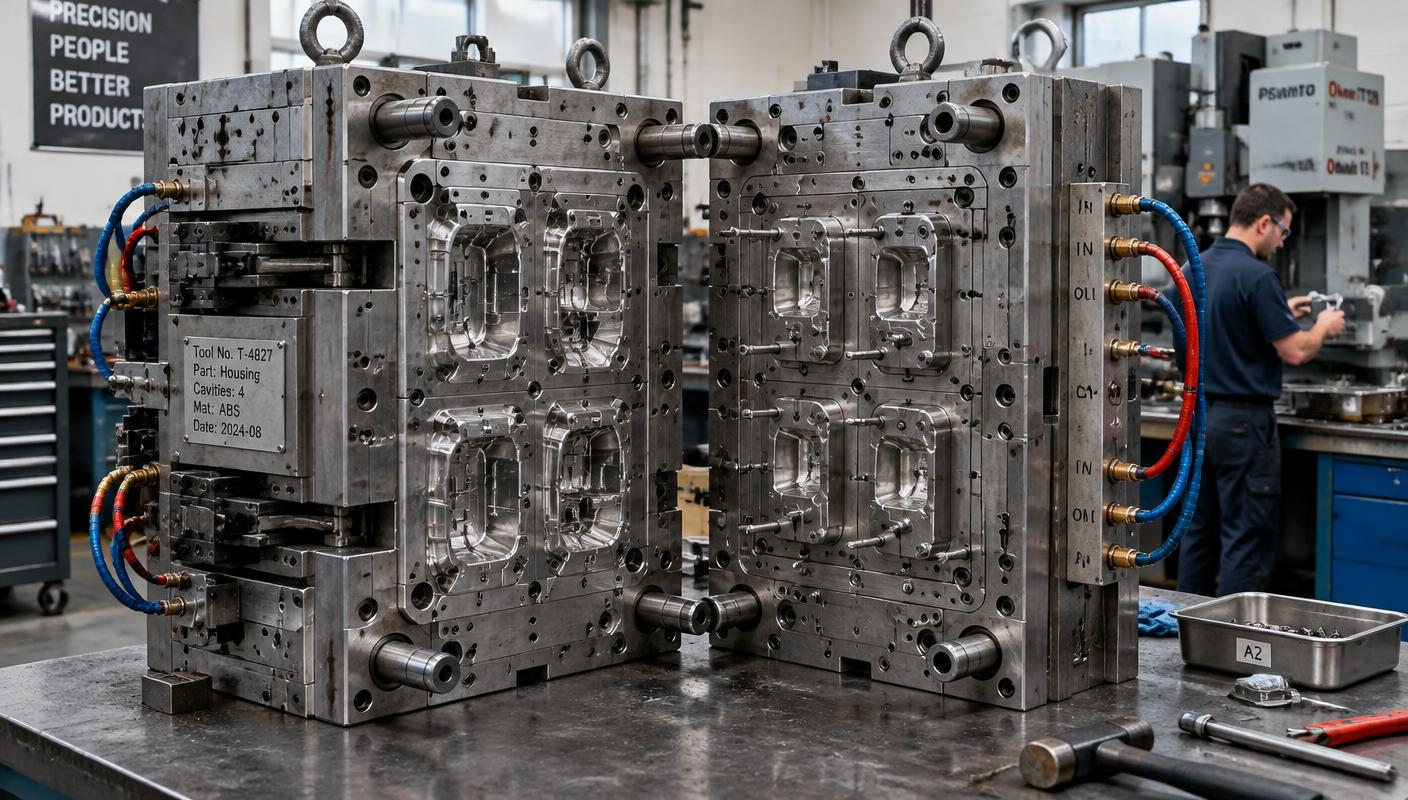
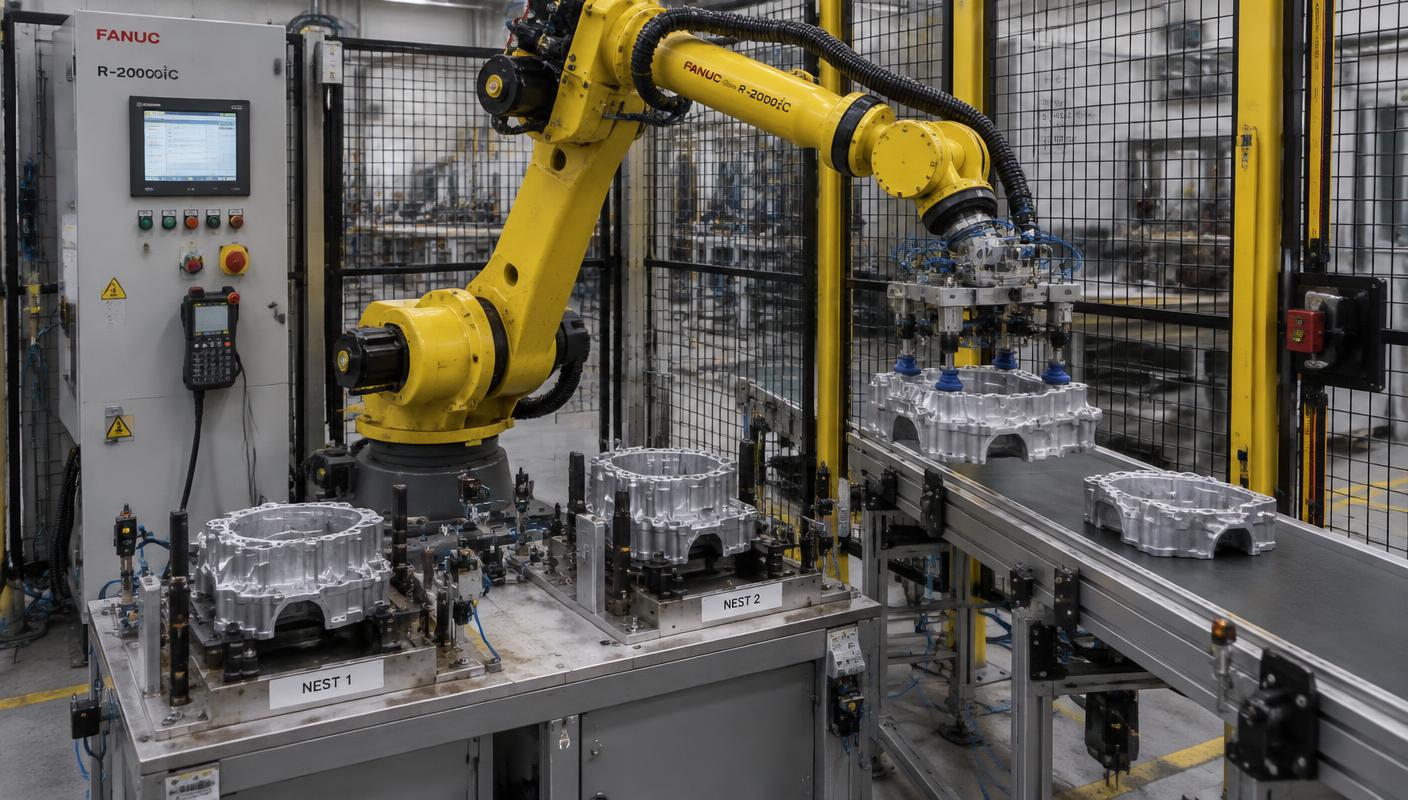
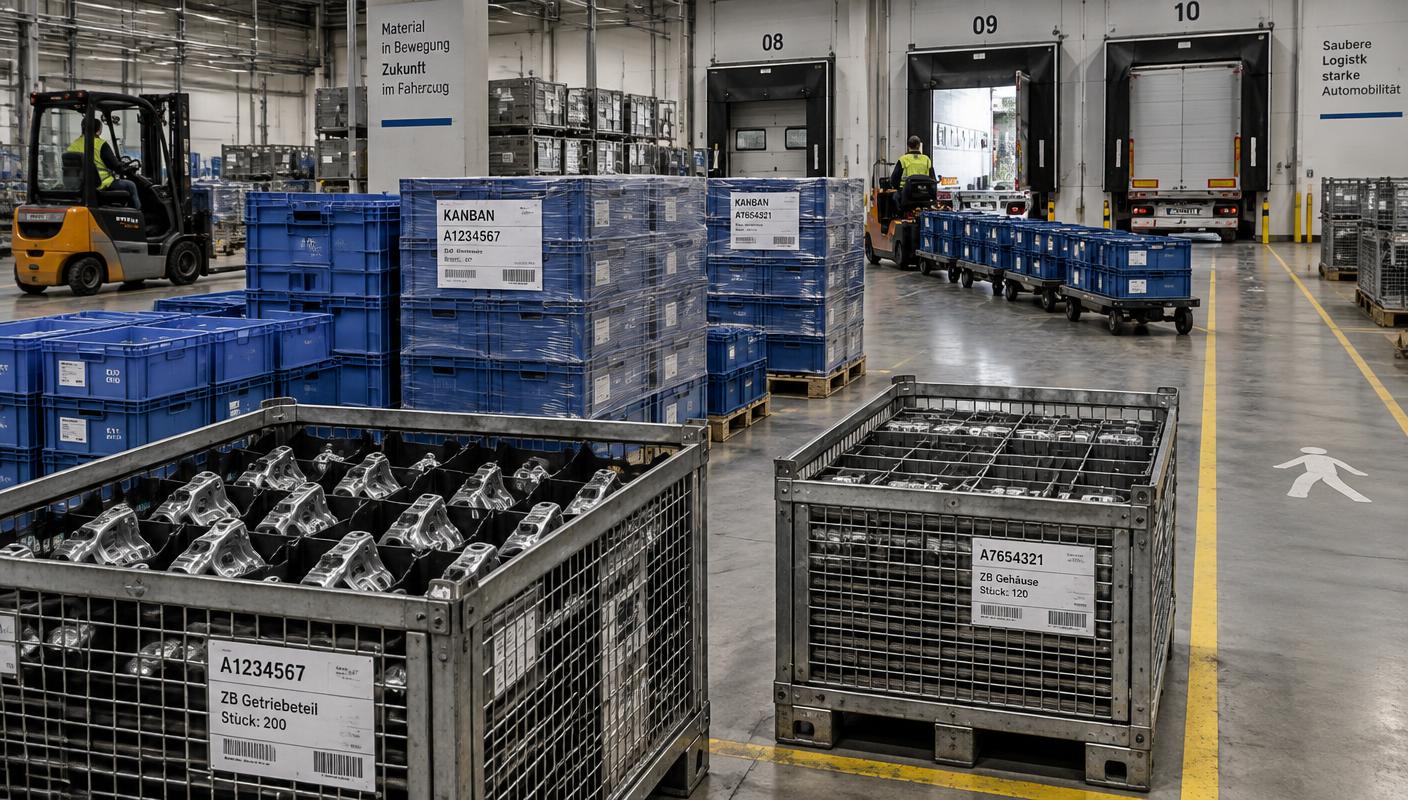
Every cost model rests on process assumptions. We build them from the technologies used to make the part — cycle times, machine classes, tooling concepts and yields — not from statistical price benchmarks.
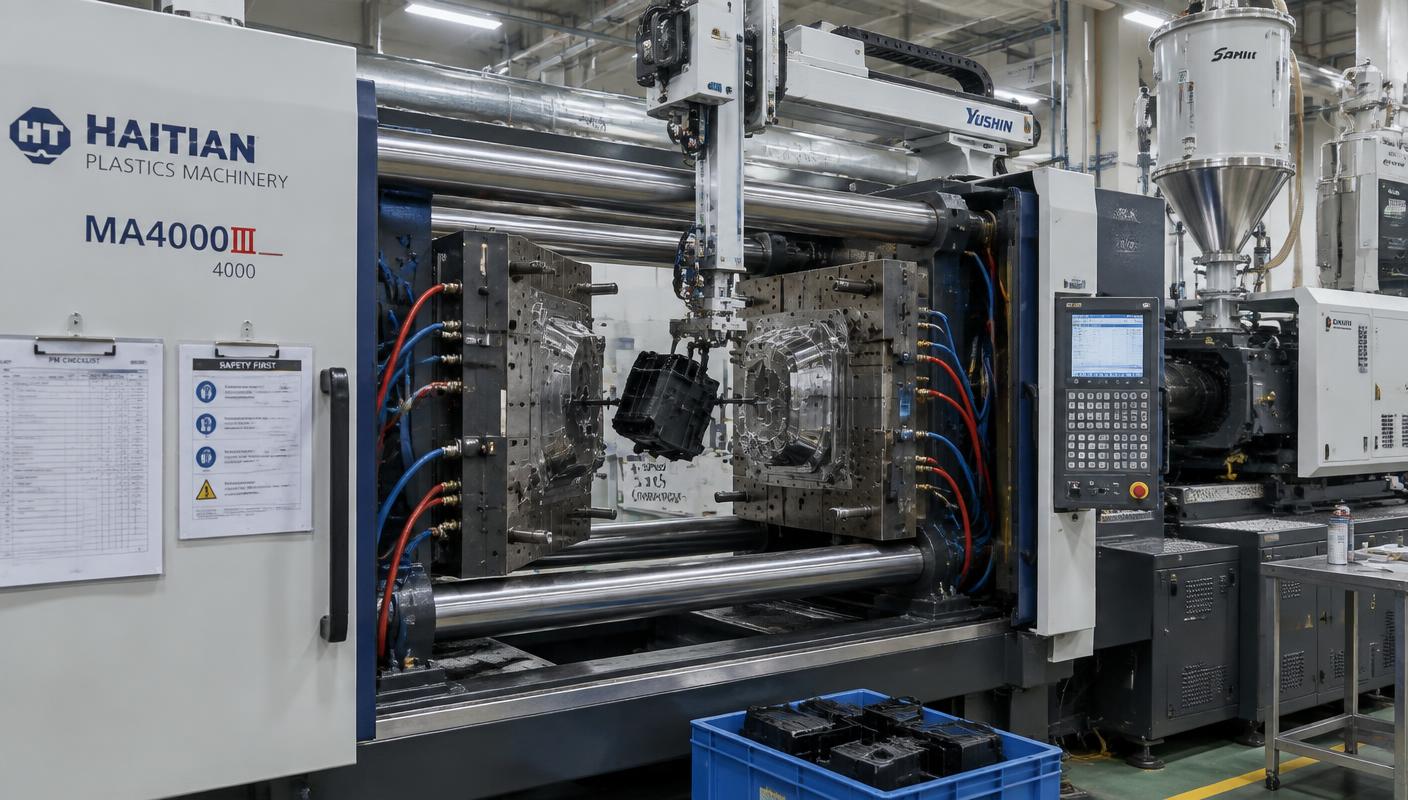
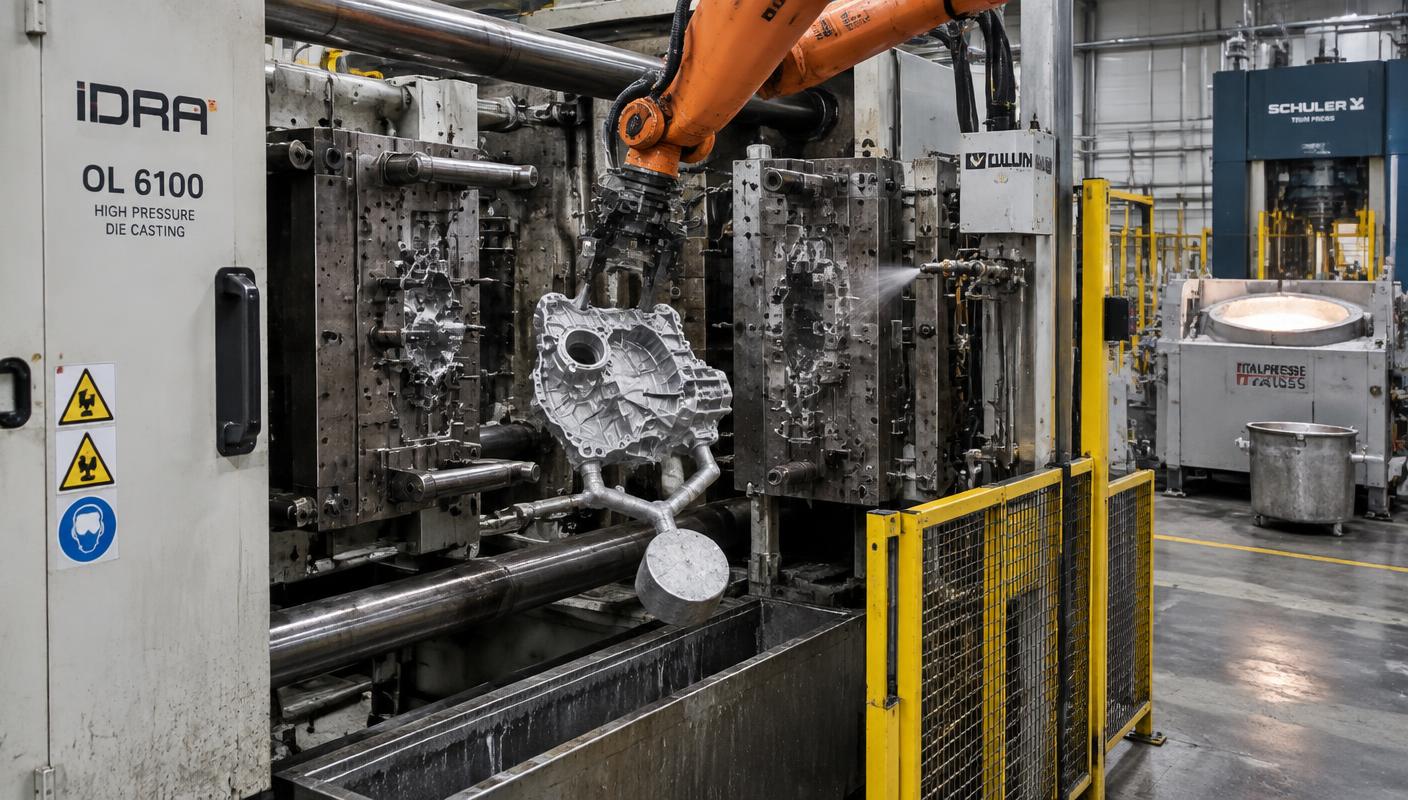
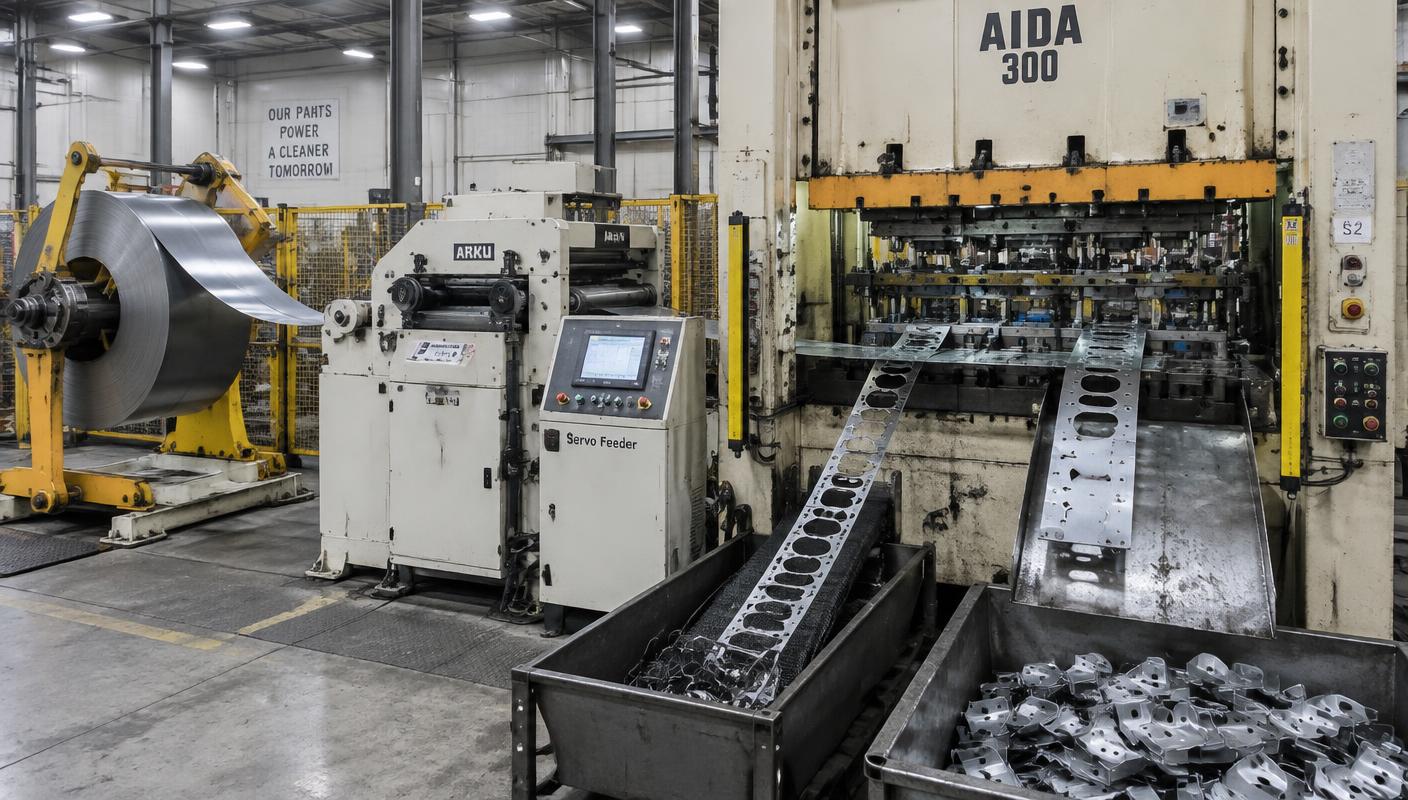
Injection Molding
Cavitation, cycle time, shot weight, tool cost, machine tonnage
Cost is driven by cavity count, cycle time and machine size. We model shot weight including runners, regrind handling, cooling time and tool amortization over realistic lifetime volumes.
Connect cost and carbon.
The manufacturing data behind a cost model — material mass, process route, energy consumption, transport and supplier site — is the same data required for carbon accounting. We use one data set for both.
- Scope 1–3
- Product Carbon Footprint
- CBAM
- Supplier Carbon Transparency
- Decarbonization Opportunities
Manufacturing practice combined with
Cost Engineering leadership.
Carbon & Cost Consulting combines more than three decades of Cost Engineering experience with hands-on manufacturing, supplier and procurement expertise across international markets. Our work is grounded in how products are actually manufactured, how suppliers build their quotations and how engineering decisions translate into product cost.

Mehmet Ali Öztopcu
Carbon & Cost Consulting GmbH
Built and led international Cost Engineering capabilities supporting manufacturing, engineering, procurement and supplier organizations.
- Should Costing
- Target Costing
- Design-to-Cost
- Product Cost Optimization
- Manufacturing Process Economics
- Cycle Time & Machine Rate Analysis
- Tooling & Investment
- Production & Assembly
- Supplier Cost Breakdown
- Quotation Analysis
- Supplier Assessment
- Negotiation Fact Base
- VA/VE
- Process Optimization
- Material Optimization
- Design Optimization
Automotive · Aerospace · Telecommunications · Industrial Manufacturing · Electronics · Medical Technology · Consumer Products
What should your product really cost?
Let's build the fact base behind your next sourcing, engineering or supplier decision.